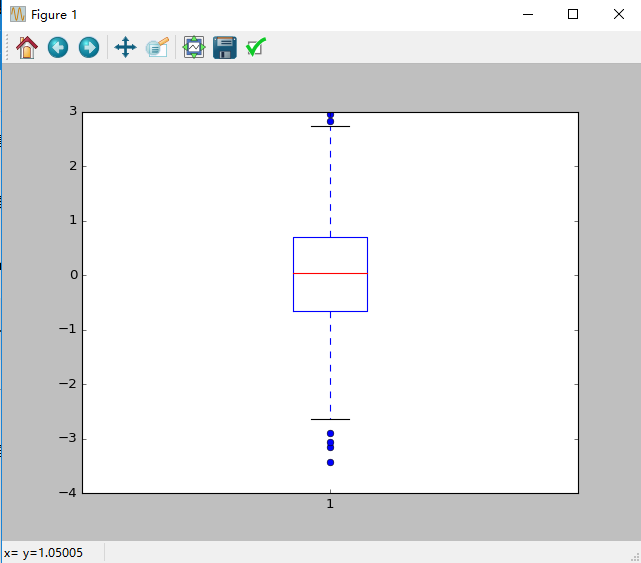
用matplotlib包画箱型图 发表于 2018-12-15 | 分类于 TensorFlow 字数统计: 48 | 阅读时长 ≈ 1 123456789101112131415#箱型图#author:victor#import moduleimport numpy as npimport matplotlib.pyplot as plt#normal distributiondata=np.random.normal(loc=0,scale=1,size=1000)#sym点的形状,whis虚线的长度plt.boxplot(data,sym='o',whis=1.5)#display the graphplt.show()