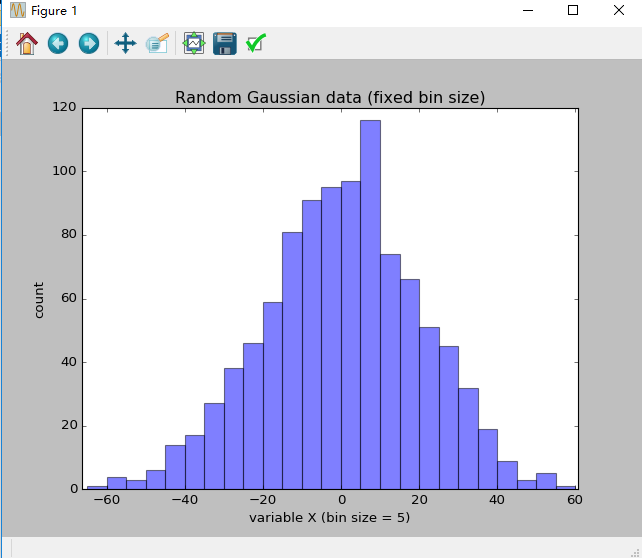
用matplotlib包画条形图 发表于 2018-12-15 | 分类于 TensorFlow 字数统计: 76 | 阅读时长 ≈ 1 123456789101112131415161718#条形图#author:victor#导入模块import numpy as npimport matplotlib.pyplot as plt#产生随机数data = np.random.normal(0, 20, 1000)bins = np.arange(-100, 100, 5) # fixed bin sizeplt.xlim([min(data)-5, max(data)+5])plt.hist(data, bins=bins, alpha=0.5)#display the graphplt.title('Random Gaussian data (fixed bin size)')plt.xlabel('variable X (bin size = 5)')plt.ylabel('count')plt.show()