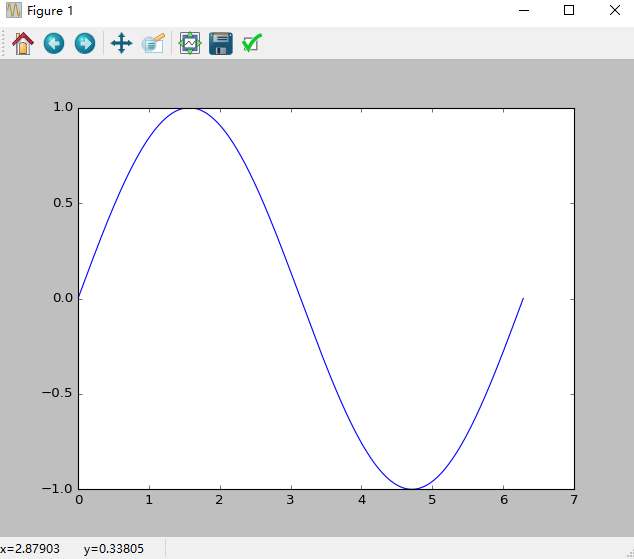
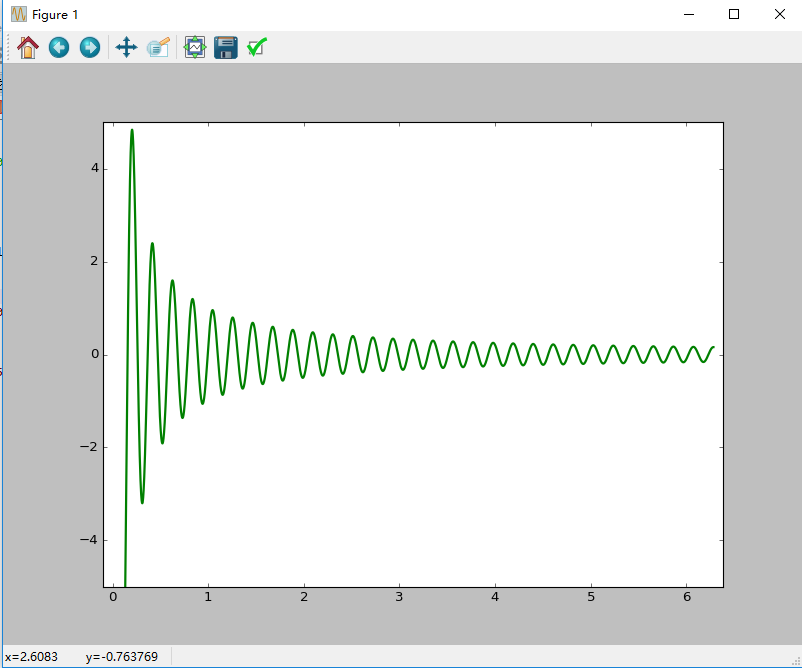
用matplotlib包画函数图像 发表于 2018-12-15 | 分类于 TensorFlow 字数统计: 142 | 阅读时长 ≈ 1 画Sinx函数图像1234567891011121314#正弦函数图像#author:victor#import moduleimport numpy as npimport matplotlib.pyplot as plt#generate numberx=np.arange(0,2*np.pi,0.00001)y=np.sin(x)#display the graphplt.plot(x,y)plt.show() 画cosx/x的图像1234567891011121314151617181920212223242526272829#画出cosx/x的图像#author:victor#import moduleimport numpy as npimport matplotlib.pyplot as plt#define functiondef f(x): return np.cos(x*30)/x#generate numberg=np.frompyfunc(f,1,1)a=np.arange(0.1,2*np.pi,0.00001)#use the functiond=g(a)#set maxsized_max=np.max(d)#set minsized_min=np.min(d)#display the graphplt.figure(figsize=(52,23.65))plt.xlim((-0.1,2*np.pi+0.1))plt.ylim((-5,5))plt.plot(a,d,'-',c='g',lw=2)plt.show()